

Summary
- Bitcoin has lost a support level that held through late August and is now testing major confluence support.
- Three unrelated on-chain readings place the real overhead ceiling in the $83K to $86K band.
- Sell-side pressure is the lightest of the year, and long-term holders are sitting the rally out.
- Short-term holders are selling into strength, and buyers keep absorbing the supply.
Bitcoin trades near $77,150 on Sept 10, sitting on a band of support that both the chart structure and three separate on-chain readings flag as the level that decides its next move. Price has slipped under the $77,617 Fibonacci line that acted as a floor through late August, and it did so on the heaviest four-hour volume of the session, which drags the $76,600 zone directly into play. The unusual part is the backdrop. The selling pressure that normally caps a run into resistance has been close to absent for the entire month.
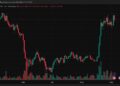
Price lost the $77,617 floor on the heaviest volume of the session
The short-term structure turned bearish before this candle printed. Price sits below the 20-period moving average at $78,607 and the 50-period average at $79,143, and both lines have rolled over and started to slope down. The faster 20-average is curling toward a cross beneath the 50, which would confirm momentum has shifted lower rather than merely paused. Since the rejection at the $82,300 swing high, every push up has topped out under the previous one, keeping price inside a descending channel of lower highs and lower lows.

Losing $77,617, the 0.236 retracement of the prior move, is the event that matters. The current red bar broke it on roughly 5,900 BTC of four-hour volume, so this is a move with participation behind it rather than a thin drift. A broken support does not disappear. It becomes the first obstacle overhead, which means any bounce now has to reclaim $77,617 before the picture improves at all.
$76,600 is where the horizontal and the channel floor collide
Directly below spot, two separate lines arrive at almost the same price. The horizontal support at $76,600 has three prior touches, and the lower boundary of the descending channel has fallen to meet it. When a horizontal level and a trendline converge, a break carries more weight than either alone, because it invalidates two structures at once. A defended bounce keeps the range intact and sets up a move back toward the moving averages. A clean four-hour close beneath it, on volume, opens the door to the next Fibonacci support at $74,718.
Three unrelated readings put the ceiling at $83K to $86K
The overhead resistance is not a line drawn on a chart. According to Glassnode, three unrelated on-chain measures independently converge on the same $83K to $86K zone, and that agreement is what gives the level credibility. Each tracks a different cohort, yet they point at the same wall.
On-chain cost basis
~$85K
~1.07M BTC sits here, mostly long-term holders. Coins near their entry tend to sell as price returns to break-even.
Derivatives
$82K–$86K
A short-liquidation shelf that grew 21% since the Aug 19 squeeze. A clean break forces shorts to cover, adding buy pressure.
Institutions
~$86K
US spot ETFs break even here after 228 straight underwater sessions. A reclaim turns them green for the first time in 2026.
Corporate treasuries break even around $80,500, just under spot, so they flip green well before the ETF buyers. Spot stopped 1.5% short of the band on Sept 3, the closest the market has come to testing it. The ceiling remains untouched.

The sellers who usually cap a rally are not showing up
Glassnode’s Sell-Side Risk Ratio, which scales the profit and loss sellers realize against the size of the asset, dropped to 7 basis points per day on a seven-day basis. That is less than half the 16 basis points seen at the August peak, and far below the 35 and 23 basis points recorded at the July and October 2025 tops. A low number means the coins changing hands are small relative to the network. The composition shifted too: the long-term holder share of realized profit collapsed from 88% in August to 47%. The profit being taken now comes from recent buyers, not the strong-hand base. Beneath price, supply in the $76K to $82K range grew while the older $62K to $65K base thinned. A repaired floor below, an untested ceiling above.
549,000 BTC reached exchanges and buyers ate the supply
CryptoQuant analyst Axel Adler measures the same absorption from the opposite end. Between Aug 19 and Sep 10, short-term holders sent 549,300 BTC, coins aged six months or less, onto exchanges. Inflows are the standard proxy for intent to sell, with the caveat that a transfer is not a confirmed sale. Over that window price climbed roughly 21% to around $77K to $78K, with a local peak near $81,800 before a 4.1% pullback. Price rose through that wave of supply instead of buckling under it.
Adler’s Short-Term Holder SOPR, where a reading above 1.0 means the average coin sold for more than its owner paid, held above break-even for 22 consecutive days. It now reads 1.0104, down from a 1.0451 peak. Still profitable, but the margin is thinning, which places the marginal seller closer to their cost. If SOPR slips below 1.0 while inflows stay high, profit-taking turns into loss-taking and the absorption story weakens.

Cycle indicators sit in the value zone, not the expensive one
The coldest-band share of Glassnode’s 45 cycle metrics stayed above the median for 41 straight weeks, the strongest bottom confluence of this cycle, before dropping to 2%. Three-quarters of the indicators still sit below their own midpoint, so the expensive zone has not been entered. Altcoins confirm it: they are up 21% on the month in dollar terms, yet the 90-day change in altcoin market share is negative at minus 0.9 points. Ahead of three of the past four Bitcoin tops, altcoin share surged by at least 2.8 points as capital rotated down the risk curve. That rotation is not happening now.
CPI on Sept 11 and the FOMC on Sept 16 decide the next leg
The macro setting complicates the bullish read. Bitcoin has gained 23% over 21 sessions while equities stayed flat, but it remains down 10% on the year against an S&P 500 up 13%. Core inflation has cooled to 2.5%, a two-year low, while the 10-year Treasury yield at 4.8% marks a two-year high, so Bitcoin is rising into a rate environment the soft inflation data does not obviously justify.
▼ Downside if $76,600 fails
$76,600
Horizontal support meets the channel floor. The decisive level.
$74,718
0.382 retracement, the next major support.
$72,375
0.5 retracement.
▲ Upside to reclaim
$77,617
0.236 retracement, now the first resistance after the breakdown.
$78.6K–$79.1K
The 20 and 50 moving averages stacked overhead.
~$80,300
Horizontal resistance and channel top, where the last rally stalled.
August CPI is due Sept 11 and the FOMC decision follows on Sept 16, either of which can move price through the $76,600 support or back toward the untested band above. The chart bias stays bearish until a reclaim of $77,617 and a push above the averages, while the on-chain thesis flips on its own triggers: the Sell-Side Risk Ratio climbing back above 16 basis points, SOPR breaking under 1.0 with inflows still elevated, or a loss of the $62K to $65K floor. A sustained close above $86K with the Sell-Side Risk Ratio still subdued would mark the ceiling as absorbed rather than defended, and that is the single condition that confirms the strong-hand read the on-chain data currently implies.
Credit: Source link