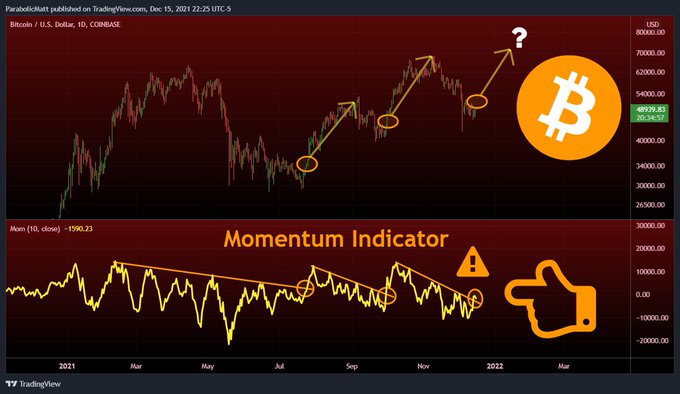
There seems to be light at the end of the tunnel for a breakout based on various indicators. For instance, the multi-month downtrend witnessed on the momentum indicator has broken out to the upside.
Bitcoin (BTC) has been ranging between the $47K and $50K area since it gained momentum from lows of $42,000 witnessed nearly two weeks ago.
According to the latest figures, Market analyst Matthew Hyland confirmed:
“Bitcoin has broken out of the multi-month downtrend on the Momentum Indicator (One Day Time Frame). The previous two times it broke out of a multi-month downtrend this year, a massive bullish move followed.”
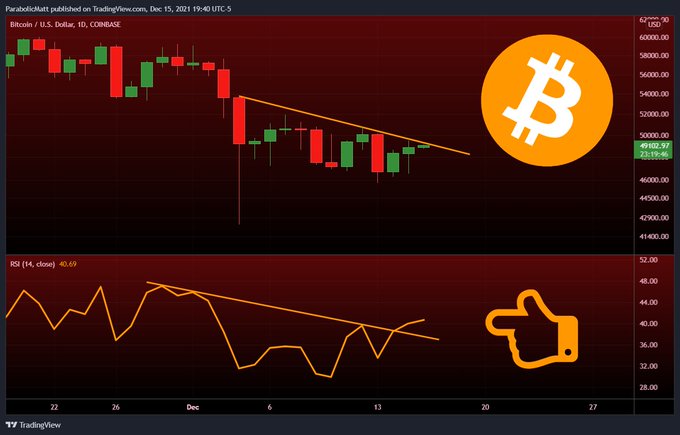
Hyland also added that the daily RSI on the Bitcoin market also witnessed a breakout.
The relative strength index (RSI) is a momentum indicator used in technical analysis that measures the magnitude of recent price changes to evaluate overbought or oversold conditions in the price of an asset.
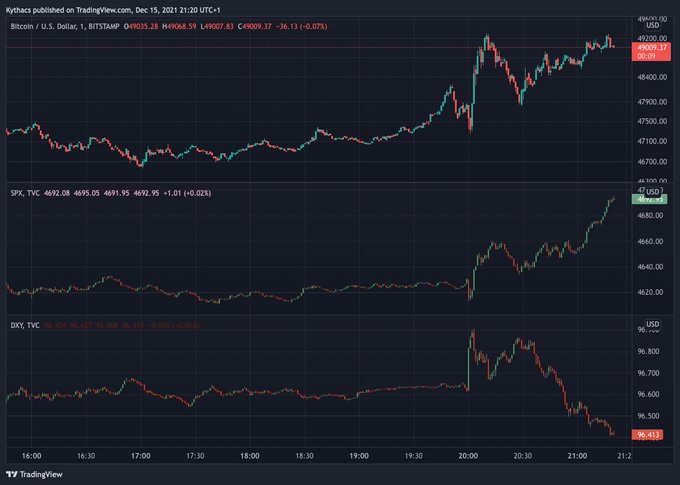
On the other hand, as Bitcoin gains momentum, the US Dollar Index (DXY) is dropping. Economist Jan Wustenfeld explained:
“Markets seem to like what they are hearing with regards to FED statements. Bitcoin up, S&P 500 up, DXY down on the short time frames.”
Research shows that Bitcoin and the US dollar are inversely correlated because, in most cases, BTC rises when the dollar’s strength decreases. For instance, as Bitcoin closed in 2020 with a 295% gain, the US Dollar Index (DXY) slipped to a 32-month low.
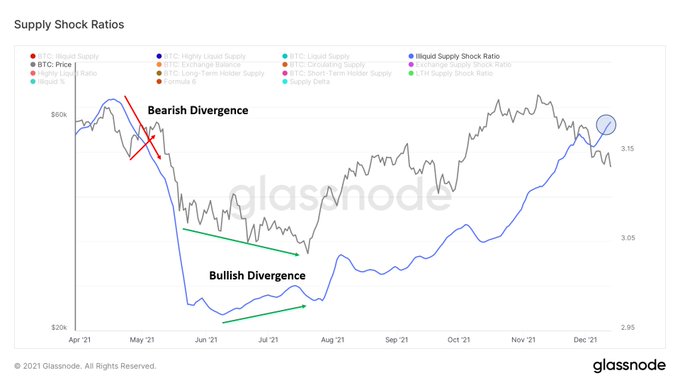
Meanwhile, on-chain analyst Will Clemente believes that strong hands are buying from weak hands from an on-chain perspective.
Strong hands are entities that historically buy and hold more than 75% of their coins, whereas weak hands purchase and hold less than 75% of their coins.
Image source: Shuttstock
Credit: Source link


