Bitcoin had seen its worst day since mid-May. Today’s high lies at $53.8K, whereas the low is below $42K. Keeping in mind Bitcoin is currently over 30% below the ATH recorded on November 10, the following analysis and overview will try to address whether or not the bull market is over and where the next significant support, in case $42K breaks down.
Futures Market Sentiment
As explained just three days ago, the futures market was overheated. Now, we can see one of the main driving forces for today’s sharp dip was the huge flush out in the crypto futures market. Open Interest (OI) drastically plunged, ~$3.7B in the last 8 hours.
Mid-Term Technical Analysis
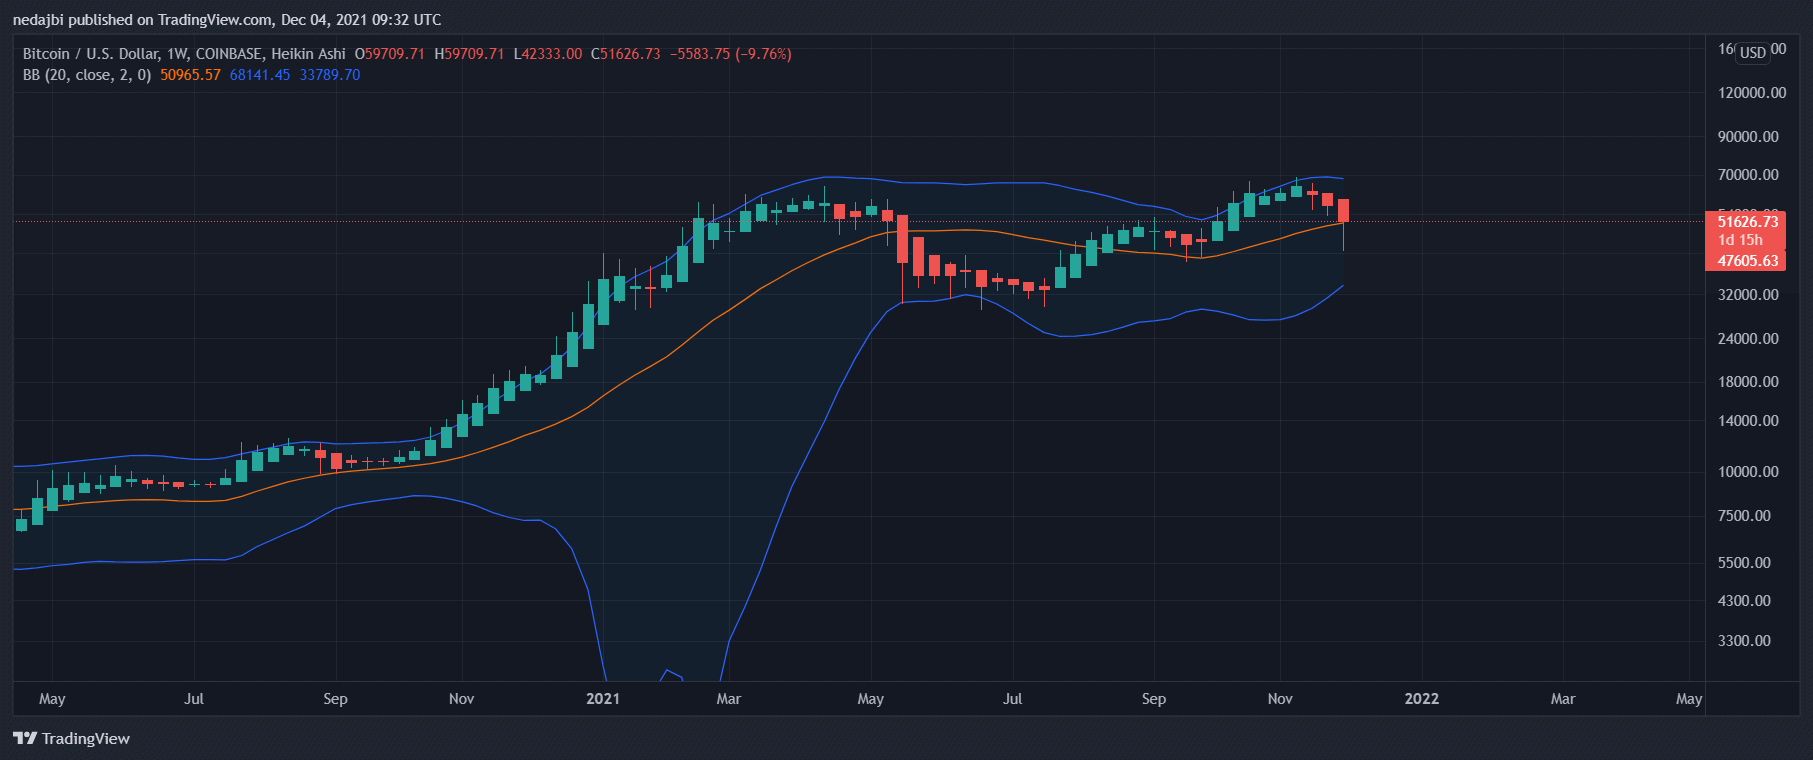
Let’s look at Heikin-Ashi candlestick on Bitcoin’s weekly timeframe while using Bollinger bands. BTC signaled a correction after touching the upper band at $69K (the current ATH from November 10).
For now, Bitcoin had found support by the middle band, along with the 20-week simple moving average (SMP). If bitcoin loses the middle band as support – there will be a possibility to touch the lower Bollinger band.
Onchain Analysis: The Buy/Sell Price Range
The majority of the Bitcoin sold over the past seven days (~ 77%) were the ones who were last moved (likely bought) above the $60K price range. Therefore, the primary sellers were the youngest buyers who sold at a loss.
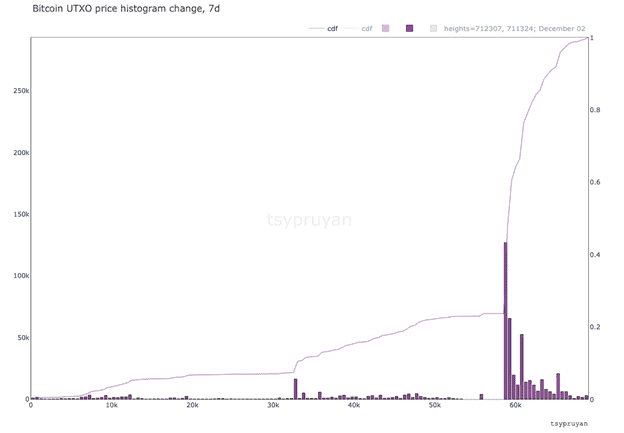
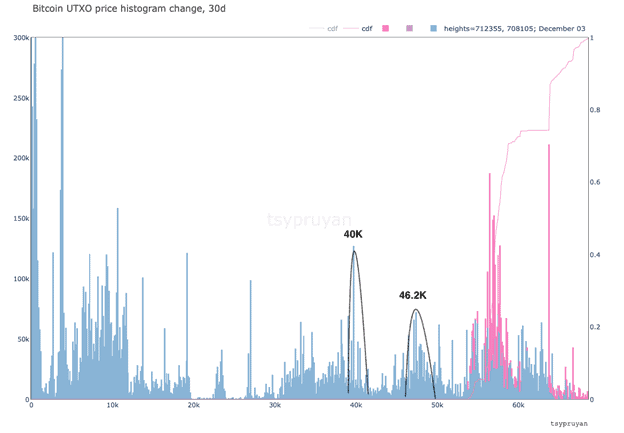
Considering the above, let’s observe the UTXO Histogram, which represents the supply distribution based on the buy price (last move).
Looking at the following chart, we can extract possible support levels if the current price further drops. $46.2K (~$46.3K is where lies the 200-day MA), and $40K are the most vital support levels based on the UTXO Histogram chart.
Options Market: OI Put/Call Ratio and Implied Volatility
Call and Put options are the two types of options contracts. A Call option is a right to buy at a future set price, and a Put option is a right to sell.
When traders buy more Puts than Calls, there will be a rise in bearish sentiment. Put Call Ratio (PCR), which measures the ratio of Puts to Calls, is a derivative indicator in the options market that can be used to understand the underlying sentiment in the market.
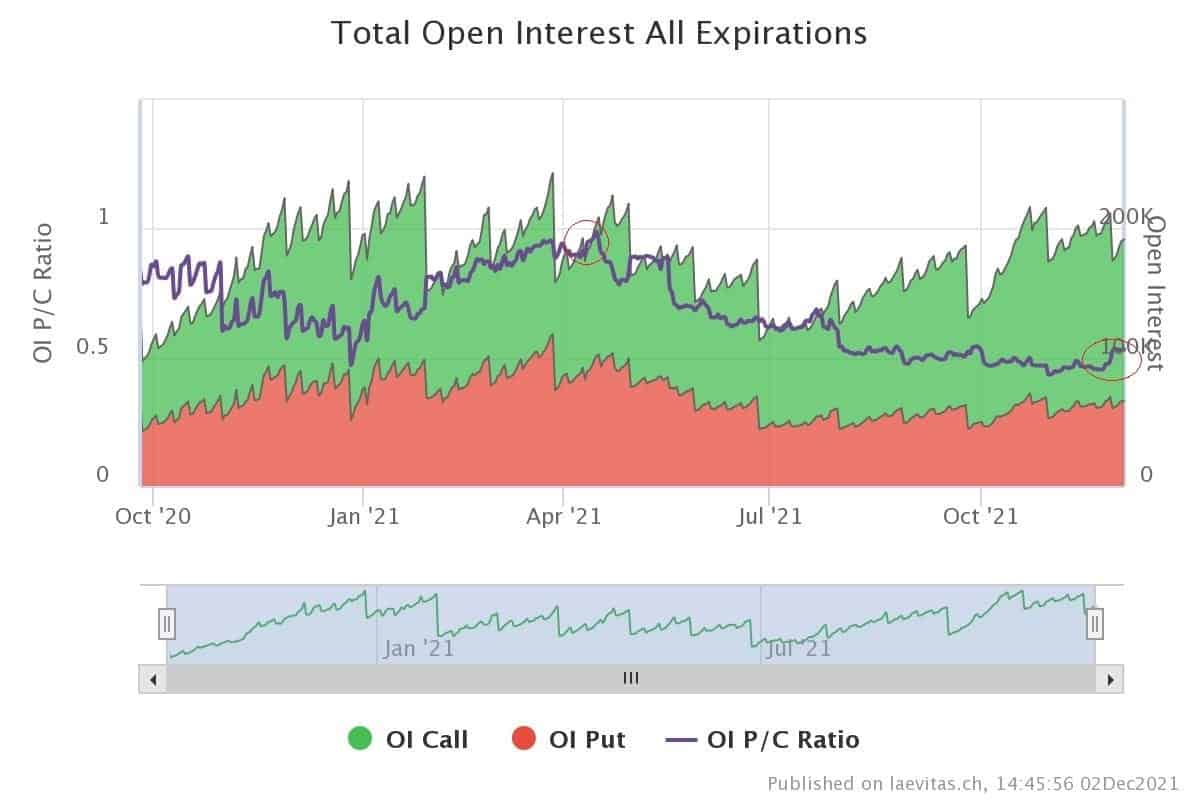
The following chart shows this ratio based on the Open Interest (OI). We can combine this ratio with Implied Volatility (IV) to get a better result.
IV is the forward-looking indicator. It reflects the risk perception in the market. Data show that PCR increased – rising from 0.43 to 0.53 – over the past month, meaning more Puts traded than Calls. IV also increased like PCR: this indicates that whenever the PCR increases together with a rise in IV, the Put activity increases. This short-term bearish signal likely caused the drop in price from $69k to $53.4K.
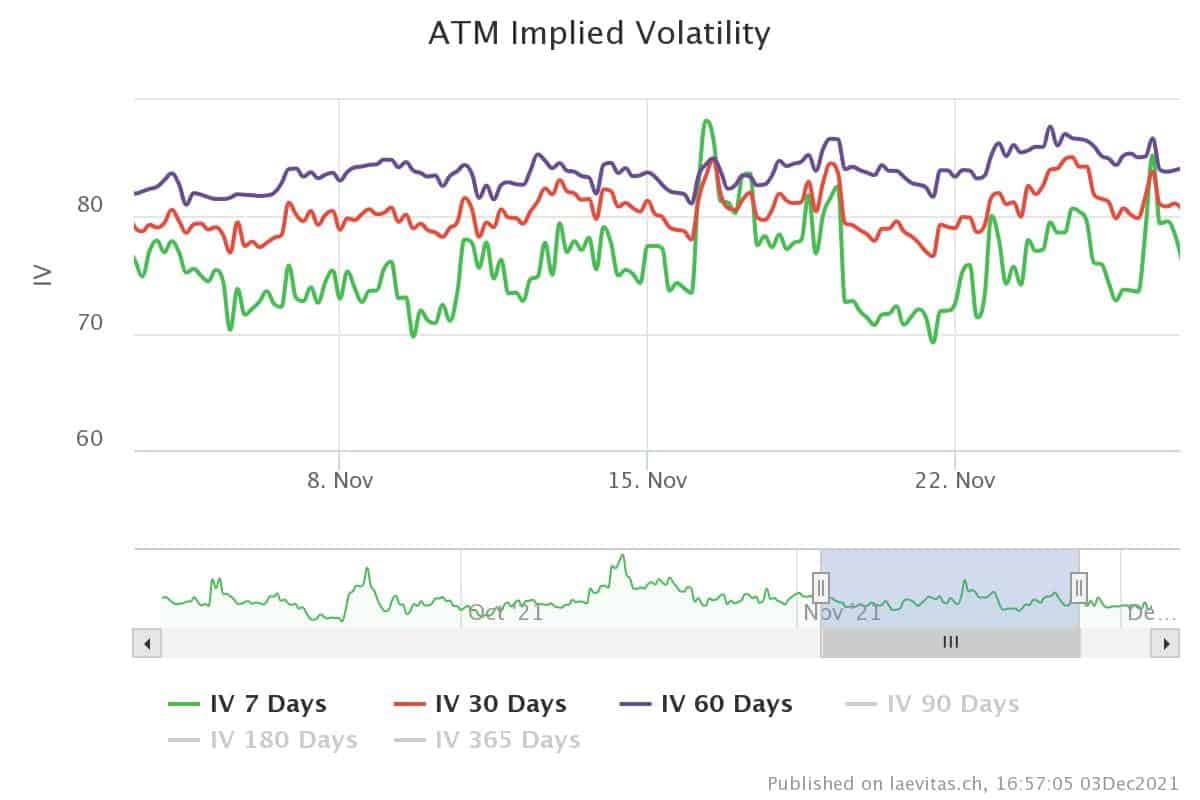
These options traders wanted to hedge their portfolios against bitcoin price drops due to other news like a rejection of VanEck’s spot Bitcoin ETF & the new Omicron variant. Bitcoin price dropped roughly 8% immediately after the WHO warned a new covid-19 variant.
The question is, did the options traders decide that this was the market top? For a better understanding:
First, we can compare the PCR in Deribit at the ATH ($69k), which was 0.46, and the PCR (0.98) at the previous ATH ($64k). As the chart shows, we are still at the low levels of this indicator over the long term.
Second, on behalf of the OI, more Calls (green) have traded than Puts (red) following the May 2021 crash for the upcoming expiries. In other words, based on the above, the bull run is not over yet.
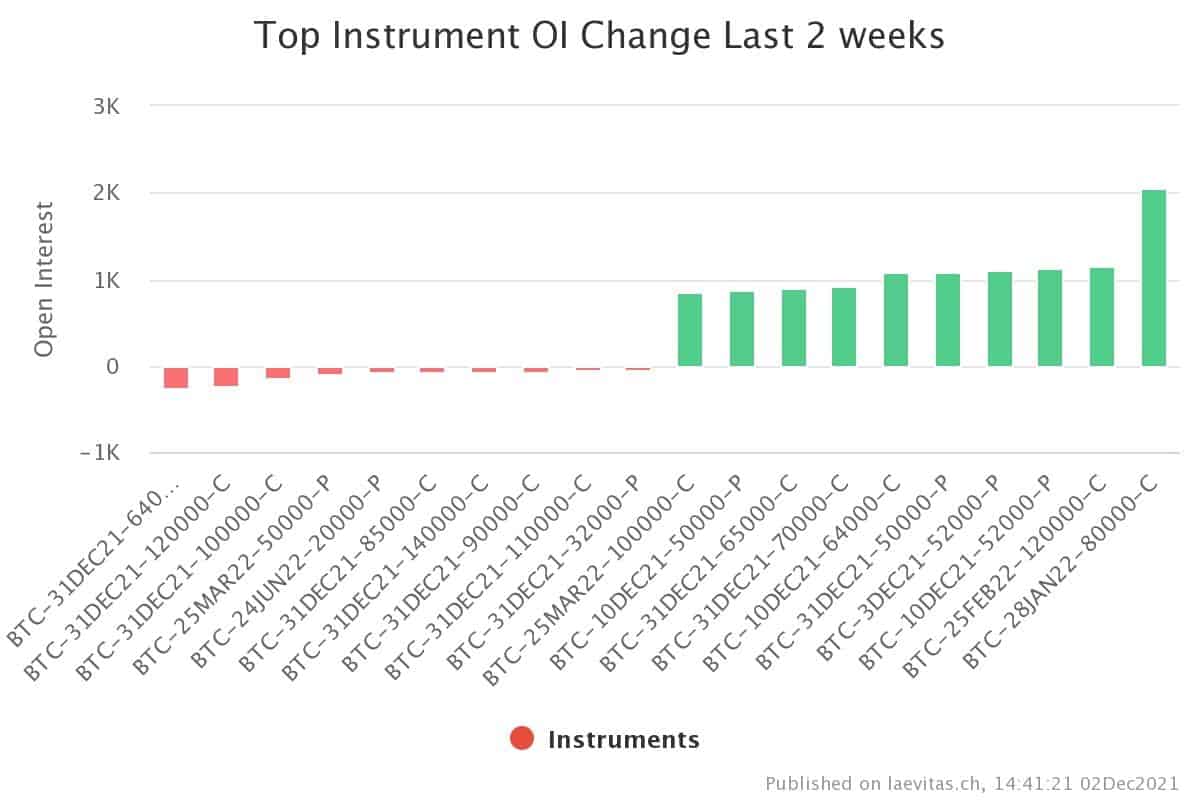
Top Instrument Open interest (OI)
Based on data from Deribit Exchange, Top Instrument Open interest in the last two weeks shows that despite the increased demand for Puts in the short-term, options traders are still bullish in the mid-term. They are interested in trading Call options at strike prices higher than $70K in the upcoming months.
The above analysis was complied by @N__E__D__A and @CryptoVizArt. Data provided by @tsypruyan exclusively for CryptoPotato.
Credit: Source link


![Best Crypto Coins to Buy Right Now Before Christmas [Backed By Experts]](https://cryptospiel.com/wp-content/uploads/2024/12/unnamed-2024-12-24T130433.644-350x250.png)


