Earlier this week, BTC made a daily close below the critical support at $30k, which can be seen as a bearish technical signal. On that day (Tuesday), the aggregate volume was significantly lower than previous drawdowns such as the May 19th selling climax when the volume clocked in at $38.5B compared to the $4.8B we saw on Tuesday – an 88% decline.
This can be seen on the following chart:
The Key MA-21 Level
A low volume close below support, especially during a long consolidation, is usually not a major sell signal. The low volume selling likely came from short-term holders (which sell at a loss), small miners, retail, and traders, which make up a small percentage of the total BTC supply.
On the other hand, long-term holders, large miners, and entities holding illiquid supply, which make up the majority of total BTC supply, have not been selling according to multiple on-chain metrics. If these large cohorts were to sell, we would have seen the aggregate volume soar to tens of billions of dollars on the day BTC closed below $30k.
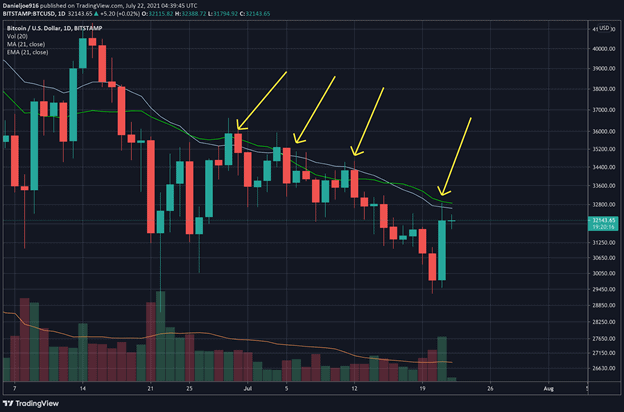
Sentiment once again reached peak bearishness, as crypto Twitter continued to make calls for BTC to fall to $20k, $15k, and even $10k. Moments like this are when BTC surprises the entire market, as the majority is usually wrong. Yesterday’s daily candle was a very large bullish engulfing one, closing above the two previous daily candles.
The recent rally pushed BTC from an intra-week low of $29.3k to a high of $32.8k, finding initial resistance at the 21 days MA line as can be seen below:
Miners Selling Pressure Declines
During the recent price surge, miners’ flows to exchanges registered a few notable spikes, suggesting small miners were selling into strength as this cohort is more price-sensitive due to more challenging capital requirements to operate. However, miner flows have dropped significantly, indicating their selling pressure has fallen and small miners may have capitulated.
First Bullish Signs: Will The 7-Month Resistance Line Finally Break?
Near-term technicals are showing early signs of strength, especially with Bitcoin staging a potential snap-back scenario to reclaim the important $30k level.
The daily RSI has formed a 7-month long downtrend consistently finding resistance with each attempt higher. The recent push has helped the daily RSI to start moving above the downtrend line. This is an early bullish signal for BTC on the daily chart, but will require a follow-through to the upside for validation.
BTC also managed to close above this near-term downtrend line with strong volume, and successfully backtested the trend line as support. The price action so far is showing early bullish signals of momentum slowly trending higher. BTC is now at a point where the price must follow through to the upside in order to validate the first major step of a potential recovery.
Fundamentals to Follow
With Elon Musk, Cathie Wood, and Jack Dorsey speaking at the B-Word event yesterday, this could be one of many near-term catalysts to spark a recovery.
Musk made it clear that his companies Tesla, SpaceX, and himself own Bitcoin and are not selling. He also confirmed his improving view of the cryptocurrency becoming cleaner with mining and that it is highly likely Tesla will resume accepting it as payment.
These positive developments could certainly help BTC reclaim $30k, and continue the near-term momentum higher as more certainty returns to the market. It is very important for BTC to reclaim $30k on a weekly closing basis which will form the snap-back scenario.
Binance Futures 50 USDT FREE Voucher: Use this link to register & get 10% off fees and 50 USDT when trading 500 USDT (limited offer).
PrimeXBT Special Offer: Use this link to register & enter POTATO50 code to get 50% free bonus on any deposit up to 1 BTC.
Disclaimer: Information found on CryptoPotato is those of writers quoted. It does not represent the opinions of CryptoPotato on whether to buy, sell, or hold any investments. You are advised to conduct your own research before making any investment decisions. Use provided information at your own risk. See Disclaimer for more information.
Cryptocurrency charts by TradingView.
Credit: Source link


![Best Crypto to Buy This Week: Qubetics, Cardano, Litecoin, Terra Classic, and Aptos [Updated List]](https://cryptospiel.com/wp-content/uploads/2025/01/AD_4nXeGd9nnWmlaga7BJwZr_W5xMuwABg2YsR1gEM4HWqaNfNxMICiE2CcrY0R9sjslWh4jGEtN6469baEwZdvUaKuIH5wFjpO_IbQx4RP0Zr99DRTOSdVpvDKmk6Zv0k8iqz5ZCEN7eA-350x90.png)


