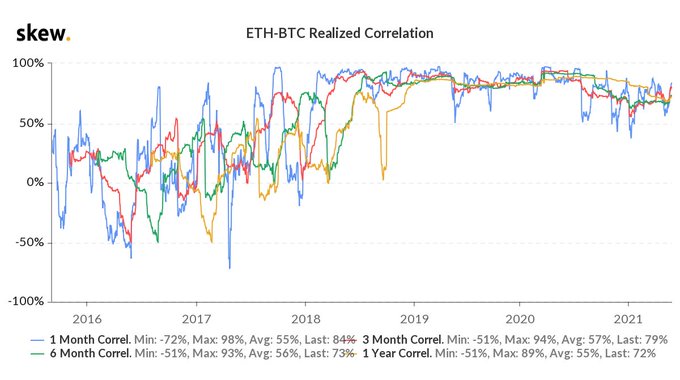
Bitcoin (BTC) and Ethereum (ETH) have had a strong correlation since 2018, despite the emergence of a new bull run last year, as acknowledged by Skew.
The crypto data provider explained:
“A high correlation regime between BTC & ETH started in 2018 and has persisted until now despite the start of a new upcycle last year.”
Messari Crypto researcher Mira Christianto recently echoed these sentiments that the relation between BTC and other crypto-assets like Ethereum and Litecoin was above 60%.
For instance, the recent market crash made Bitcoin shed more than half its price from highs of $64.8k to lows of $30k. On the other hand, Ethereum lost half of its market capitalization after hitting an all-time high (ATH) of $500 billion, whereas its price slumped to lows of $2,000 from the highs of $4,350.
Furthermore, the search volume on Google for BTC and ETH reached the highest point this year.
Bitcoin struggles to soar above the 200-Day MA
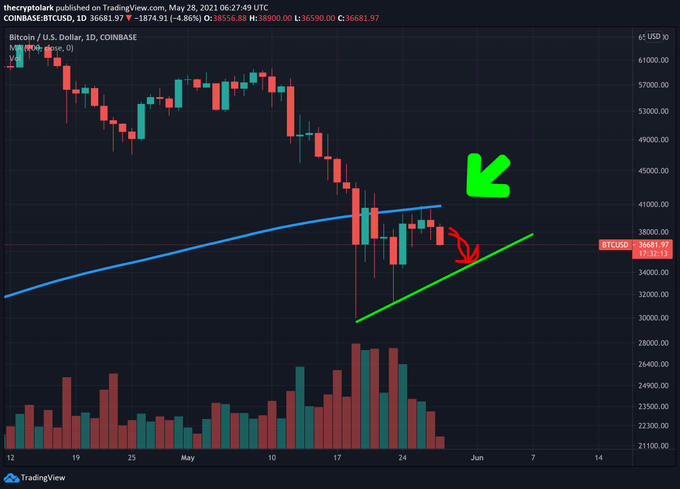
BTC’s dropping price recently experienced made its price go below the 200-day moving average (MA) indicator, and this was a trend not seen since March 2020.
The 200-day MA is a line that shows the average closing price for the last 200 days or roughly 40 weeks of trading.
Bitcoin, therefore, continues hovering below this indicator as alluded by market analyst Lark Davis.
The significant level of Bitcoin on-chain resistance stands at $43.6k
According to on-chain metrics provider IntoTheBlock:
“The IOMAP indicator reveals that the $43.6k level is the next big level of on-chain resistance for Bitcoin, with 333k addresses holding over 133k BTC.”
Bitcoin was trading at $35,640 and Ethereum at $2,453 during the time of writing, according to CoinMarketCap.
It, therefore, remains to be seen whether the top two cryptocurrencies will regain momentum to continue with their impressive bull runs for the remaining part of the year.
Image source: Shutterstock
Credit: Source link


