After hitting lows of $30k, Bitcoin (BTC) was once up 5.45% on Wednesday, trading at $40,278, according to CoinMarketCap.
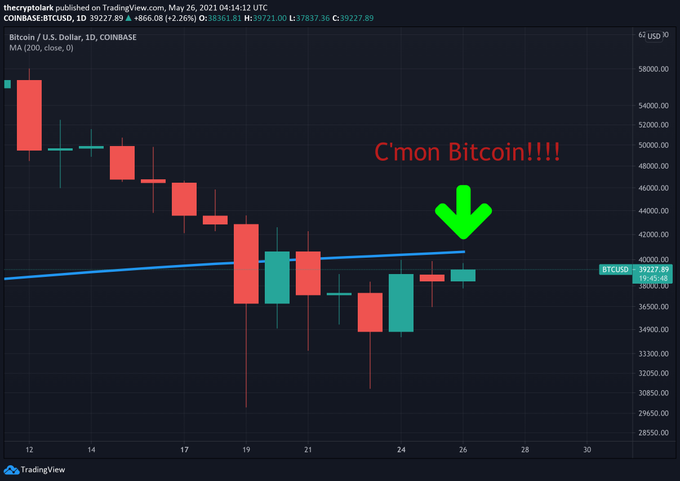
BTC suffered a sharp correction on May 19 as the price fell to around $30,000, resulting in the biggest single-day drop of price, up to 30%. Furthermore, this price drop became the first time BTC had dropped below the 200-day moving average (MA).
The 200-day MA is a key technical indicator used to determine the general market trend. It is a line that shows the average closing price for the last 200 days or roughly 40 weeks of trading.
Market analyst Lark Davis disclosed that the regained momentum has pushed Bitcoin closer to the 200-day MA.
A move above this indicator signifies an uptrend.
An analysis from CryptoHamster revealed that BTC ought to trade above $34,000 for an upward move to be triggered.
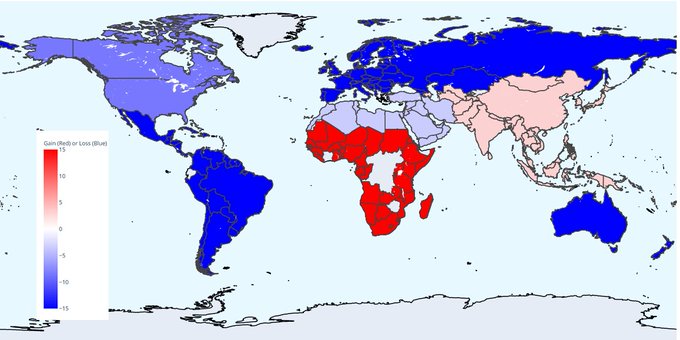
Africa leads in peer-to-peer Bitcoin trading.
According to crypto data provider Documenting Bitcoin:
“Africa is leading the world in peer-to-peer Bitcoin trading volume growth, with 22% in the last three months.”
In July last year, it was reported that African nations like Kenya, South Africa, Nigeria, and Ghana had traded Bitcoin worth more than $1 million in a single week.
It, therefore, shows that Africa is still a hub of BTC trading undertaken in peer-to-peer platforms.
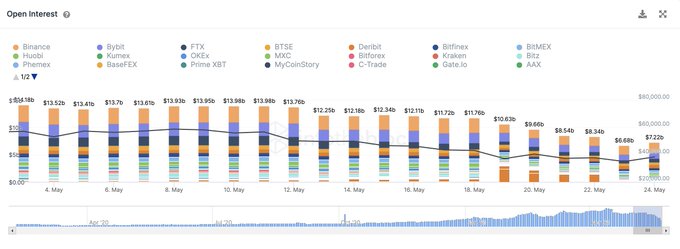
Bitcoin open interest starts to gain momentum.
Crypto research analyst Nick Mancini disclosed that Bitcoin open interest had bottomed, but it seems it is starting to lift higher as the big gamblers are flipping bullish.
Market trader Joseph Young also pointed out:
“There are a lot of Bitcoin wallets at a loss now compared to a few weeks back. Historically, when this capitulation-esqe trend happened, a sustainable gradual uptrend followed. Let’s observe several FUD points/variables at play, but looking better than not.”
As a result, that needs to observe if Bitcoin will surge past the 200-day MA later.
Image source: Shutterstock
Credit: Source link


